Efficient Frontier

William J. Bernstein
Efficient Frontier
William J. Bernstein
![]()
The Cowards' Update
In the Cowards' Update for 1999, we looked at the beleaguered condition of the cowards, pummeled again by one more year of S&P 500 outperformance. The asset-class scene reversed course in the year 2000, however, with many "unconventional" assets outperforming the S&P 500. Here's the situation for the three-, five-, and ten-year periods:
(Those of you unfamiliar with the four coward portfolios, take a look at the July 1997 update for a detailed description of them and the methodology used.)
As before, the robots are doing pretty well for the full ten-year period, but over the three- and five-year periods the picture is a little bleak. With the revival of value investing in 2000, things have begun to look up a bit, in particular, for the long-suffering academic cowards. What's truly amazing, though, is the rightward explosion in the scatter of the active managers (into the high-risk region), particularly noticeable in the three-year plot, as many investors are rudely awakened to the bets being taken in their portfolios.
Even though 2000 was a good year for the well-diversified investor and 1999 excellent for the global investor, these two years clearly do not make up for the relative devastation preceding them. Consider the three- and five-year returns for the index funds tabulated below. Large-cap growth still leads the pack by a wide margin:
Index Index Fund Sampled 3-Year Return 5-Year Return Continental Small Companies DFA Continental Small Company 6.66 9.15 Emerging Markets (equally weighted) DFA Emerging Markets 3.28 -0.09 Small Japanese Stocks DFA Japanese Small Company 6.32 -15.94 EAFE Index DFA Large-Cap International 9.32 7.96 Pacific Rim Small Companies DFA Pacific Rim Small Company 3.95 -5.75 U.S. Small and Medium Companies DFA U.S. 6-10 Small Company 6.68 12.16 U.S. Small Companies DFA U.S. 9-10 Small Company 5.06 10.87 U.K. Small Companies DFA United Kingdom Small Company 6.26 10.03 REITs DFA Real Estate Securities 2.12 11.21 S&P 500 Vanguard 500 Index 12.30 18.31 Emerging Markets (cap weighted) Vanguard Emerging Markets Stock Index -1.41 -1.58 EAFE-Europe Vanguard European Stock Idx 11.33 15.76 Precious Metals Stocks Vanguard Gold & Precious Metals 4.68 -7.01 U.S. Growth Stocks Vanguard Growth Index 12.51 19.17 EAFE-Pacific Vanguard Pacific Stock Index 6.10 -3.93 U.S. Value Stocks Vanguard Value Index 11.04 16.69
The best automaton conitnues to be the Tweedy Browne coward's portfolio with its worldwide Graham-and-Dodd approach. Once again, the more passively managed a coward's portfolio, the worse it performed.
According to Morningstar, the average "global" and "asset allocation" fund has only about 20% of its allocation abroad and is overly concentrated in large growth stocks, with an average PB of 6.4 and a median market cap of $37B. The analagous index composition over the past five years would be an 80/20 S&P/EAFE mix. By way of comparison, I plotted the five-year performance of the active managers versus a porfolio consisting of the relevant DFA funds, mixed with DFA's one-year bond fund:
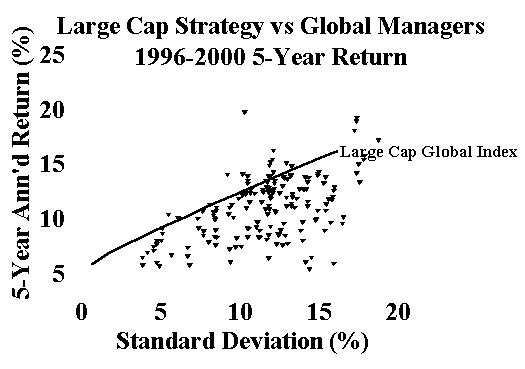
This puts the performance of the active-management crowd into high relief: Clearly, their good fortune is due almost entirely to asset allocation. Further, it would appear that most of them couldn't transact their way out of a paper bag. Of course, it is just possible that the active managers are exhibiting skill in asset-class management by virtue of choosing this winning allocation. So let's bring on a few more years of outperformance by small, value, and foreign stocks, and see how good these folks really are.
The most disturbing thing about the above data for the efficient marketeer is the dominance of the Tweedy Browne Global strategy. For those of you unfamiliar with Tweedy Browne, this management team employs a highly diversified, disciplined, nation-blind value strategy. As such, the authors of "What Has Worked in Investing" and "Ten Ways to Beat an Index" seem to be fulfilling their promise. Nevertheless, appearances can be deceiving. Their portfolio—hedged and largely European—has been in the "sweet spot" of global equity and currency markets for the past half decade. (Hedging the EAFE has added 3% per annum to returns over the past five years.) It remains to be seen how they will do when those worms turn.


Copyright © 2001, William J. Bernstein