Efficient Frontier

William J. Bernstein
Efficient Frontier

William J. Bernstein
![]()
The Coward's Update
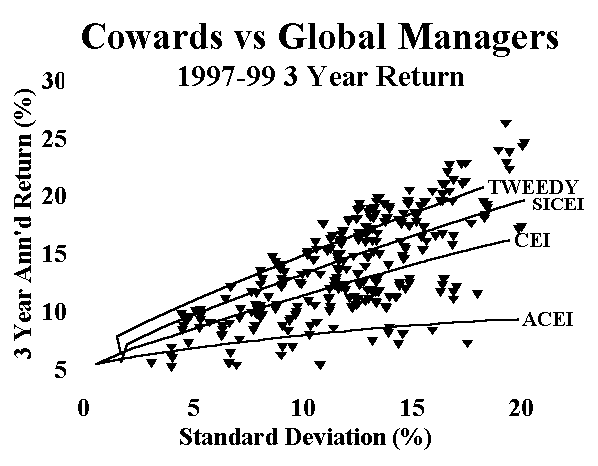
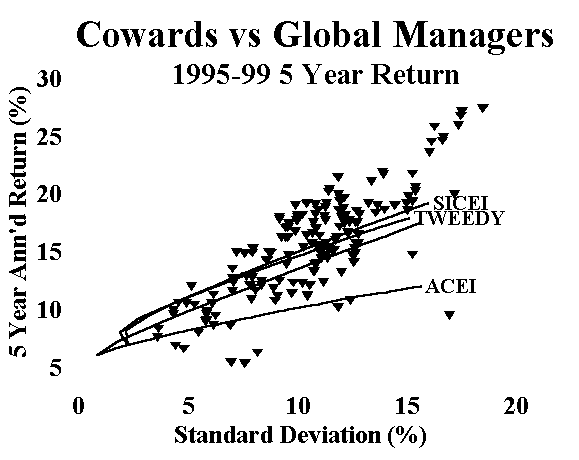
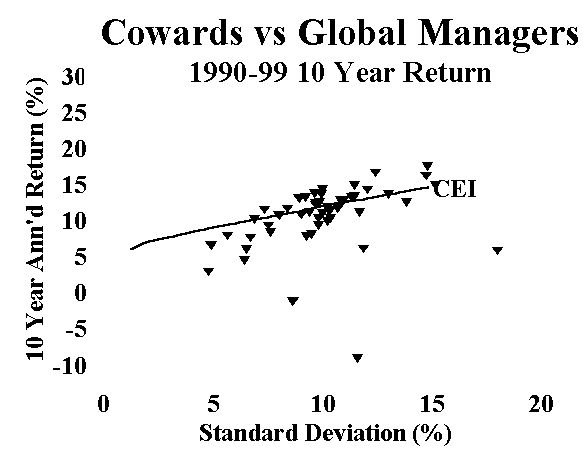
In last year's Coward's Update we surveyed the rapidly worsening condition of the cowards, who were battered by yet another year of S&P 500 dominance. While still critically ill, their condition stabilized somewhat this year as multiple other asset classes finally joined the party. Here's the situation for 3, 5, and 10 years:


The CEI in the 5-year graph is sanwiched between the Tweedy portfolio and the SICEI. For those of you unfamiliar with the cowards, take a look at the July 1997 update for a detailed description.
Again, over the past 5 years most of the professional global fund managers have bested the portfolio robots, whereas over the 3 and 10-year periods it's about a dead heat. I expanded the vertical scale on the 10-year graph, exposing the downside outliers so as to demonstrate the nature of "active manager risk" in the global asset allocation game. Those outliers are also there for 3 and 5 years, but at the compressed scale the 4 cowards would have been difficult to separate. There are no upside outliers.
Even though 1999 was a superb year for the global investor, this in no way made up for the carnage in the preceding 2, 4, and 9 years. Consider the following 3-year and 5-year returns for the index funds tabulated below:
Index (Index Fund Sampled) 3 Yr. Return 5 Yr. Return Continental Small Companies DFA Continental Small Company 9.13 8.25 Emerging Markets (Equally Weighted) DFA Emerging Markets 8.04 7.49 Small Japanese Stocks DFA Japanese Small Company -18.56 -14.82 EAFE Index DFA Large Cap International 17.03 14.02 Pacific Rim Small Companies DFA Pacific Rim Small Company -7.26 -2.39 US Small-Medium Companies DFA U.S. 6-10 Small Company 13.76 17.66 US Small Companies DFA U.S. 9-10 Small Company 13.88 18.50 UK Small Companies DFA United Kingdom Small Co 9.26 13.40 REITs DFA/AEW Real Estate Secs -0.34 8.24 S&P 500 Vanguard 500 Index 27.53 28.49 Emerging Markets (Cap Weighted) Vanguard Emerg Mkt Stk Idx 3.24 5.09 EAFE-Europe Vanguard European Stock Idx 23.115 22.59 Precious Metals Stocks Vanguard Gold & Precious Met -8.40 -6.44 US Growth Stocks Vanguard Growth Index 33.87 27.79 EAFE Pacific Vanguard Pacific Stock Idx -11.14 -4.01 US Value Stocks Vanguard Value Index 21.91 19.79
This table speaks for itself. The worst performing automaton continues to be the academic coward, with its heavy exposure to Japan, value, and very small stocks. The best conitnues to be the the Tweedy Browne coward, with its worldwide Graham-and-Dodd approach. Perversely, the more passively managed the coward, the worse it performed.
It's well to step back and consider some market history. Ten years ago the Japanese were buying up the crown jewels of American real estate and industry, fatuous novels were being written about a world controlled from Tokyo, and the Nikkei was the place to be. Twenty years ago? Real estate and gold. And thirty years ago? The one-decision big growthies of the Nifty Fifty. Sound familiar? In each case, capitulating to the era's asset class zeitgeist would have been a disaster.
On a more prosaic note, the last 5-year period the S&P 500 outperformed foreign stocks was 1979-84, with five year annualized returns of 17.27% and 10.06% (EAFE), respectively. The annualized return for the following five years was 20.41% for the S&P and 36.52% for the EAFE.
So, patience. The cowards will soldier on. You'll see them again next year.
Copyright © 2000, William J. Bernstein. All rights reserved.