The Intelligent Asset Allocator

William J. Bernstein
![]()
How Good is the Value Line Appreciation Index?
I suspect that hundreds of thousands of investors all over the country
take the same financial sacrament once every month or two, usually in the
course of a routine visit to the public library. A quick look at the front
cover of the latest Value Line supplement, and check out
the valuation indicators for the Value Line Universe: P/E, dividend yield,
and the 3-5 year appreciation index. Any serious investor wants to know
just how expensive or cheap the market is, and the Value Line indicators
are probably the most expeditious way of finding out. (Investor's
Business Daily and Barron's are a close second.)
For example, the 5/23/97 edition of VL tells us the following:
| Current
(5/23/97) |
Market High
(9/4/87) |
Market Low
(12/23/74) |
|
| Price Earnings | 16.9 | 16.9 | 4.8 |
| Dividend Yield | 2.0 | 2.3 | 7.8 |
| 3-5 Yr. Appreciation | 50% | 40% | 234% |
The above data should suggest to cautious investors that we're not in
Kansas any more. Are the old yardsticks still useful, or are we in a new
era? I'll leave that food fight to others, but will remind readers of John
Templeton's admonition: "The four most dangerous words in the English
language are 'This time it's different.'"
The 3-5 year appreciation index holds a special fascination for investors
-- here is a direct projection of asset expected return, and it gets very
good press. Mark Hulbert, for instance, citing Dan Seiver's PAD System
Report, states forthrightly that all you have to do is subtract
55% from the 3-5 year estimate to accurately predict the 5 year S&P
return. Interestingly, Mr. Seiver himself, although relying on the appreciation
index, denies ever having published a study on the issue.
Well, fans, the truth is out there. I sent Mr. Seiver my check for $15,
and 3 weeks later received a diskette with the 3-5 year appreciation index
from 1968 to the present. I then correlated it with future 5 year returns
for the S&P 500. I did the same for the dividend yield, PB, and PE
ratios back to 1926, using the Ibbotson data for S&P return, and the
Value Line data for valuation.
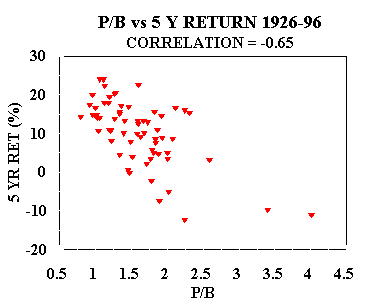
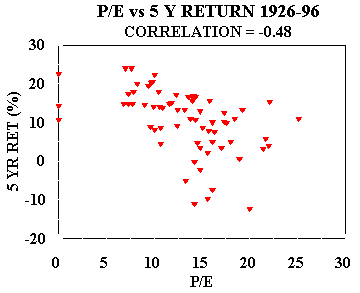
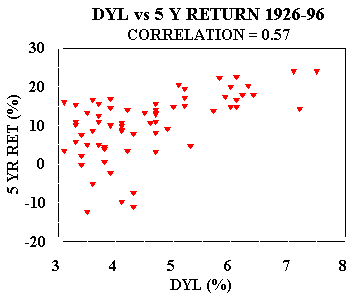
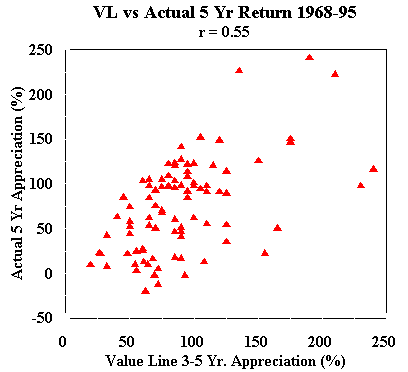
Here's how the correlations stack up:
| 1926-96 5 Yr. Returns | 1968-95 5 Yr. Returns | |
| Price/Book | -0.65 | -0.44 |
| Price/Earnings | -0.48 | -0.54 |
| Dividend Yield | +0.57 | +0.61 |
| VL 3-5 Yr. Appreciation | ------- | +0.55 |
Remenber that the sign of the correlation is irrelevant in judging it's quality. A correlation of -0.55 is as good as +0.55.
Some of the x-y plots for the data are shown below. Remember, the 1926-96
data for PE, PB, and DYL is for annual data points, and the VL 1968-95
data is quarterly. For the first 3 graphs the "5 year return"
is an annualized value, for the last graph with the VL data
the "5 year return" is a total return value.


So, how good is the 3-5 year appreciation index? Not too bad, but probably no better than the other three indicators. In fact, all four indicators are nothing more or less than a simple proxy for price. All other things being equal, each indicator will change in linear fashion with the price of the S&P500 or the Value Line Index.
I sure wouldn't bet the farm on any of these 4 parameters, i.e., try
to use them to judge when to be 100% in or out of stocks. However, it does
seem to be profitable, at least in the long run, to make small and infrequent
adjustments in your stock/bond mix based on valuation data. What you find
when you play asset allocation spreadsheet games with these parameters
for the 1926-94 period (see The Intelligent
Asset Allocator, Chapter 5) is that increasing or decreasing
your stock exposure according to valuation indicators does improve both
return and risk slightly. However, once you use one of the indicators,
adding in a second to the mix doesn't add that much further benefit, for
the simple reason that all of these indicators are measuring the same thing
-- price.
Mind you, correlations in the 0.45-0.65 range are nothing to sneeze
at. In fact, I don't know of any other indicators of future equity return
which work nearly as well as the above 4 parameters. What I find truly
astonishing are the prevalence of unfounded assertions of the validity
of various other markers of future return. A few years ago there were pieces
in both The Wall Street Journal and the AAII Journal
describing how dividend yield was worthless as a market indicator. Inflation
adjusted dividend yield, it was asserted, was far better. Well, the
inflation adjusted dividend yield is trivial to calculate and correlate
with future return, and the correlation turns out to be very close to zero.
The analyst interviewed for the AAIIJ piece had never actually
looked at the data. To its credit the AAIIJ printed some
irate letters pointing this out, but for some reason I never saw an errata
in the WSJ.
The next time somebody tells you about a dandy new market barometer, casually ask them "So, Bob, what's it's correlation coefficient with future returns?" Then, watch the smile disappear from their face.
![]()
![]()
copyright (c) 1997, William J. Bernstein