Efficient Frontier

William J. Bernstein
Efficient Frontier

William J. Bernstein
![]()
Who Killed Value?
Pity the poor value investors. Nurtured on the elegant prose of Benjamin Graham, the folksy humor of Warren Buffett, and the daunting statistical elegance of Fama and French, they’ve languished in the wilderness with fifteen years of excruciating underperformance. What went wrong?
Countless have taken no small pleasure in the misery of this unhappy band of brothers, for in many cases they constitute the sometimes less-than-humble Best and Brightest in finance. The cheap shot is all too tempting. Usually it doesn’t go much beyond a gleeful dunning of pointy-headed academics who wouldn’t know a stock ticket if one landed on their overhead projector.
Another explanation, perhaps closer to the mark, is Rekenthaler’s Rule: "If the bozos know about it, it doesn’t work anymore." In other words, as soon as an anomaly is uncovered, it is arbitraged out of existence.
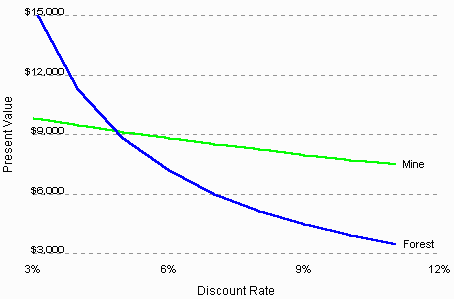
The truth, I believe, is somewhat more complex and much more interesting. But first, if you haven’t yet done so, do read the piece "Of Mines, Farms, Forests, and Impatience," in the Spring 2001 issue, before proceeding. To recap, Irving Fisher’s mine is similar to a value stock—its cash flow is "front-loaded" and likely to slowly decrease over time. Fisher’s newly-planted forest is, of course, a growth stock, with zero income up front and dividends gradually kicking in as the decades wear on. Since the value of both of these enterprises is their total stream of annual income discounted to the present, an increase in the discount rate hurts the mine (value stock) much, much less than the forest (growth stock). I’ve slightly modified the graph from the last article in order to display this phenomenon.

The observation that higher interest rates are more harmful to growth than value stocks is not new, but there has been surprisingly little attention devoted to this in the growth-versus-value debate, particularly from a historical perspective.
In order to examine the problem, I took advantage of Ken French’s wonderful Web site and downloaded the HmL series (a familiar Fama-French acronym for "high-minus-low" book value), which goes back to July 1926. This series basically represents the return of the top third of stocks sorted on book/price, minus the return of the bottom third. In other words, the value-minus-growth return difference. A positive number signifies higher returns for value stocks, and vice versa. The simple plot of monthly inflation versus HmL is an eye-crossing scattergram, but the slope of HmL on inflation is clearly positive, with a t stat of 2.91 and a p value of .0037. So there is indeed a significant positive correlation between inflation and value return, albeit a very noisy one.
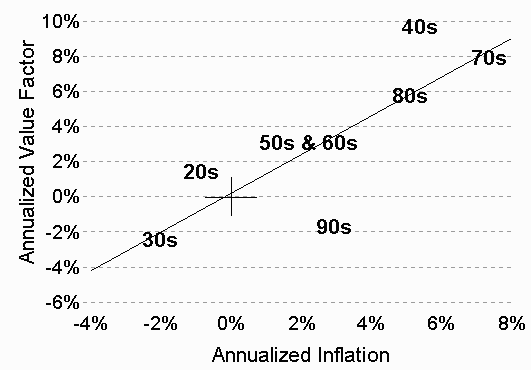
A much more impressive picture emerges when we plot annualized HmL versus inflation by decade. (Note that the "20s" data point constitutes only a three-and-a-half-year period, beginning in July 1926).

The data using decade periods are also quite robust, with a t stat of 3.41. Because there are only eight data points, it is visually more impressive, but has a lower p value than the monthly analysis, though still highly significant at .014.
The original Fama-French paper covered a period of very high inflation, the years 1963-1990, and consequently showed a robust value effect. Towards the end of that period, interest rates and inflation commenced a long and powerful decline, which continues to this day—just the sort of environment expected to favor growth stocks. (There’s also a weaker, secondary correlation here—the rate of change of inflation with HmL—which depressed the ’90s HmL more than predicted by the inflation rate.) So while Fama and French’s research was impeccable, their timing was unlucky, to say the least. Mystery solved: value’s killers are two nefarious characters named Volcker and Greenspan. Do not attempt a citizen’s arrest.
This formulation also explains why value investing was such a life-saver in the crunch of 1973-1974 with its raging inflation, and why growth investing dominated in the Great Depression, characterized by the worst period of deflation in American history.
What of the future? The fascinating thing about the decade plot is that its regression line passes almost exactly through the graph’s origin (the cross in the lower-left part of the plot). In other words, in an investing state-of-nature—say a Grover Cleveland world of unfettered capitalism, gold standard, and zero inflation—growth and value stocks have equal returns. The slope of HmL on inflation is 1.1, so each one percent of inflation adds about one percent of HmL. Thus, if inflation stays at 2% to 3%, we can expect an HmL of similar size. And not coincidentally, the HmL for the full 74 years from July 1926 to June 2000 was 3.36%, while inflation was 3.12%. As long as there is fiat currency, there will be inflation; in the long-run, the value premium seems assured.
The most interesting feature of these data is that HmL is much more dependent on the absolute level of inflation than its rate of change. Why, in an efficient market, does a statically high (or low) rate of inflation produce high (or low) HmL? After all, one would assume that a static high or low inflation rate would be discounted into prices. This gets to the heart of the value premium. For if markets are truly efficient, this premium can only be compensation for some sort of risk. An alternative explanation is that markets are not efficient in the value dimension; that in fact, investors overestimate the magnitude and persistence of earnings increases for growth stocks, thereby overpricing them, and underpricing value stocks.
The evidence in favor of this "inefficiency" explanation is powerful. For example, in June 2000 the top 30% of all stocks sorted by PE, weighted by market cap, had a PE of 40, whereas the bottom 30% had a PE of 7. (These included only stocks with positive earnings. Source: Ken French’s data library.) What kind of earnings increase can we expect from these top-30% growth companies? Actually, not very much. Empirical research shows that superior earnings growth has a half-life of about two to three years. So let’s make some generous assumptions. Assume that the average company selling at a PE of 40 grows its earnings at 2.5% per month for the first year, then 2% per month, 1.5% per month, 1% per month, and 0.75% per month in succeeding years, before settling down to the 0.5% per month earnings growth of the rest of the market in the sixth year. (This annualizes out to 33.8%, 26.8%, 19.6%, 12.7%, 9.4%, and 6.4% growth per year for the six years.) Now contrast that with these assumptions for a typical value company: a PE of 14 and earnings growth at the market rate of 0.5% monthly (6.4% annual).
As you can see from the graph, the earnings of the growth company never overtakes that of the value company, in spite of its superior growth. This is because it starts out earning only 2.5 cents per dollar of equity, whereas the value company starts out earning 7 cents. The hare never catches up with the tortoise. So after a few years, the growth-stock investor wakes up to find his company’s superior growth has largely disappeared, and he is unhappy. This translates into falling prices and lower returns. And in a high-inflation environment, he will be even more disappointed, since his now slightly-higher earnings growth is worth much less because of higher inflation. In this case, the damage will be even worse. Hence the higher value-minus-growth returns gap with high inflation.
A warning: Fama and French’s HmL is a long-short portfolio and unattainable in actual practice. Even the hardcore upper-third DFA portfolios obtain a value loading of only about 0.65 or so, for a projected total excess return of about 2% per year, before expenses. The Vanguard value portfolios have slightly lower HmL loadings (in the .55 range) but with lower expenses. Happily, both organizations seem to manage negative transactional costs with surprising regularity.
So, value enthusiasts, rejoice¾ investing in cheap stocks has not gone the way of John Cleese’s parrot. Even as we speak, value investing is slowly rising from its coffin. The renaissance of the dull may have only just begun.
Copyright © 2001, William J. Bernstein. All rights reserved.
The right to download, store and/or output any material on this Web site is granted for viewing use only. Material may not be reproduced in any form without the express written permission of William J. Bernstein. Reproduction or editing by any means, mechanical or electronic, in whole or in part, without the express written permission of William J. Bernstein is strictly prohibited. Please read the disclaimer.