Efficient Frontier

William J. Bernstein
Efficient Frontier
William J. Bernstein
![]()
The Magic of Percentile Compounding
One of the wonders of financial journalism is the ink wasted on the reporting of short term money manager rankings. Most serious observers know that fund rankings over monthly, quarterly, or even annual periods are virtually meaningless. The importance of the of the time period examined cannot be overemphasized. In the previous piece I showed that we can expect 40th percentile index fund performance in an average year, but that it is not unusual to find an index fund at the bottom of the pile in any given year. In fact, it is not unusual to see index funds underperform for far longer periods. But the more years you string together performance averaging at the 40th percentile, the better indexing looks. The easiest way to think about this is to consider a decathlon competition with 100 entrants. An athelete who averages 40th place in the 10 events will probably come in about 15th overall, and the winner's average performance in each event is likely to be not much better than 20th. Over the longest evaluation periods available for large cap domestic, foreign, and emerging markets fund returns indexing shines. Only in the small cap arena, where index fund returns are hobbled by the poor performance of the index as a class, is the issue in much doubt.
Assume that you've just arrived from another planet, and are looking for a place to park the fortune some guy from Pentagon Ordnance paid you for your hyperspace transport module. Being good with numbers, you collect daily returns for the stock market, and discover to your horror that 49 percent of the time its return is lower than t-bills. Consider what would happen if the financial media ranked mutual funds every day. We'd be treated to headlines like "Treasury Money Market Funds Shine on Groundhog Day!" 49 percent of days you'd conclude that you were better off in cash. Extending our horizons, 38 percent of months and 28 percent of years had negative returns. Only when intervals longer than several years are chosen do negative returns largely disappear. The same thing is true of index fund performance. Any measurement period of less than 5 years is meaningless, and periods as long as 20 years may be necessary to demonstrate indexing's superiority for some asset classes.
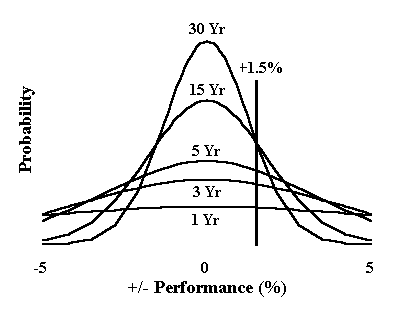
Let's see how this plays out over long time periods. Let's take the easiest case to understand—large cap US stocks. In the previous piece we calculated a 1.5 percent index advantage in this area. The average spread of annual fund returns can be measured by calculating the standard deviation ("SD") of individual fund returns for a given year. For large cap funds, this averages about 7 percent. So, in an average year the index will perform about 1.5/7 = 0.21 SD above the mean, meaning that it will place in the 42nd percentile. {For those of you without training in basic statistics, this is calculated by plugging 0.21 SD into something called a "normal distribution function," which can be found on all spreadsheets. For example, in Excel you would enter =NORMSDIST(0.21).} So far, so good. Statistical magic transpires as the years pass. The index fund advantage will still be 1.5 percent each and every year, but the SD of fund returns decreases by the square root of the number of years. The SD for 15 years will thus be 7/sqrt(15) = 1.81 percent. So now the index fund performs 1.5/1.81 = .83 SD above the mean, putting it at the 21st percentile. And at 30 years it's at the 13th percentile. Again, this may be a bit difficult if you're unfamiliar with statistics. I've represented it graphically below with a bell curve diagram:
As you can see, the 1 year curve is a very wide, flat pancake. Moving 1.5 percent off center doesn't get you very far out the curve. As the time period increases, the distribution curve of fund performances becomes very thin and peaked. Moving 1.5 percent to the right on the 30 year curve leaves seven eighths of the active funds in the dust, off to the left of you.
Plugging in the same kind of data for small caps and internationals from the previous piece puts you at the 5th percentile after 15 years, and for emerging markets at the first percentile. I've not done extensive analysis for bond funds, but for long duration high grade corporate funds the index advantage is about 0.8 percent, with an average fund return SD of about 2 percent, which yields the same magnitude of index fund advantage as seen with emerging markets portfolios. If you'd like to download the very simple Excel spreadsheet which does this calculation, click here .
From a theoretical viewpoint, indexing seems like a no brainer in all stock categories. In the real world, of course, the pretty bell curves shown above can get knocked into rather untidy sand piles by things like the small cap premium and variance among national market returns for considerable periods of time.However, in the long run, the relentless push of the indexing advantage will eventually overwhlem these factors and result in agreeable performance.


copyright (c) 1999, William J. Bernstein