Efficient Frontier

William J. Bernstein
Efficient Frontier
William J. Bernstein
![]()
What’s Cheap
Yield Vignettes Successful allocation involves more than the manipulation of mere abstract entities with historically determined expected returns, risks, and correlations. Rather, we purchase interests in businesses. In the case of common stock our capital is rewarded with an earnings stream, which will hopefully increase over time.
In the case of bonds, we purchase a fixed flow of dividends with varying degrees of safety. One can purchase treasury securities which promise near absolute security of principal, or alternatively bonds of lower grade, and be rewarded for bearing higher risk. At the lowest tier of the domestic debt market are so called "junk bonds," whose long term ability to meet fixed dividend charges is uncertain.
Many, if not most, investors who invest in junk are woefully uninformed as to how much risk premium they are being paid for rolling the dice. Tucked away in a remote corner of the Wall Street Journal is a little gem of a daily table which is provides this information, if in somewhat cryptic form. It’s well worth the periodic attention of every investor.
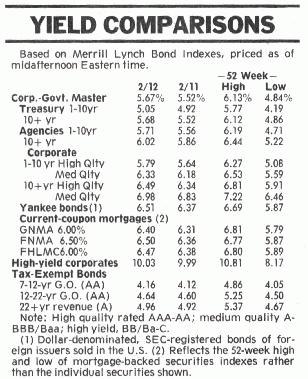
It's found in the back of the "Money and Investing" (C pages) embedded in the daily "Credit Markets" piece, just below the "Treasury Yield Curve" graph, contained in a table labelled "Yield Comparisons:"
I’ve magnified the table so that the yields may be more easily read:
(This is a very small table, so forgive the smudges and poor reproduction quality.) The previous day’s yields are listed in the far left column. The two key values are the 10+ (long) treasury yield of 5.68 percent (third from the top) and the high yield corporates 10.03 percent yield (bottom).
The key parameter is the difference between these two values—4.35 percent (10.03 minus 5.68). This so-called "junk treasury spread" ("JTS") is the premium that one is paid for risking default and bankruptcy. The JTS is a wonderfully simple thing. It tells you that if on average more than 4.35 percent of issuing companies disappear annually, you would have been better off in treasuries, and vice versa. The true average annual default rate of these companies is a matter of some dispute, but 3 percent is a figure not many will disagree strongly with. The crucial concept here is average default rate. This can vary greatly from year to year, exceeding 10 percent in severe recessions, or approaching zero in good times. Further, the bondholder is quite high up on the creditor food chain, so only flat bankruptcy will completely destroy the investment in any given company. (It goes without saying that we are talking about mutual fund investing here, not investing in individual bonds.) Default often means delay in coupon payment, but not total, or even substantial, loss of ultimate value.
The real value of the JTS is its relationship to historical norms. The past 10 years have been highly instructive in this regard. Thanks to Mike Milken and his merry crew, in 1991 it rose to about 9 percent, and early last year it actually fell briefly below 2 percent. When do you suppose was the better time to buy? It should be noted that the values quoted by the Journal are from the Merrill Lynch Bond Index series, which represents a slightly higher quality of junk than other indexes, so the JTS calculated from this table may be lower by about a percent than the JTS calculated elsewhere.
The JTS may also be viewed from the opposite perspective, namely, as the "price of safety." At just 2 percent a year ago, safety (e.g., treasuries) was dirt cheap. And in 1991, when we were looking at the brink of war and recession, it was quite expensive, at 9 percent.
So take a peek at this table every so often. Sooner or later it may just save you some grief.
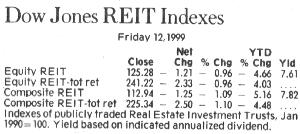
More of the REIT Stuff Another useful Section C Journal table is even more obscure and harder to find—the Dow Jones REIT (real estate investment trust) yield. This is found in the commodities columns, about 1-2 pages in front of the bond tables. Here’s what it looks like:
The index yields are the two values in the right hand column. The slightly higher yield for the composite REIT index includes some mortgage companies which are excluded from the equity REIT index. Mortgage REITs are usually highly leveraged companies, have lower historical total returns than equity REITs, and are probably best avoided.
Since by law REITs must pay out 95 percent of their earnings, this is as good a measure of valuation in this sector as any. Right now equity REITs yield about 7.5 percent, which is pretty close to an historic high. The correlation between REIT yields and returns is loose, but adding a few hundred basis points to the yield provides a conservative estimate of the long term return in this sector. In 1993 the REIT yield fell below 5 percent, just about the time when every other advisor quoted in the nations’ financial pages were extolling REITs as relief for 3 percent treasury bills. Months later, REITs tanked. For the REIT investor, yield provides a superb reality check.


copyright (c) 1999, William J. Bernstein