Efficient Frontier

William J. Bernstein
Efficient Frontier
William J. Bernstein
![]()
The Dunn’s Law Review
"When an asset class does well, an index fund in that asset class does even better."—Steven Dunn
No concept threatens the investment professional more than indexing. After all, if even the most skillful and best-informed analysts cannot persistently outperform, why pay their advisory fees? Why incur their transactional costs? In short, why should the investing public support what is in effect an enormous class of trust-fund children?
Human nature being what it is, plausible rationalizations are offered. The oldest and hoariest is the "efficiency argument," which goes something like this; "We’ll admit that indexing works well with large cap stocks, but the markets in small and foreign stocks are inefficient; that’s where you need the benefit of (our) active security analysis." This gets repeated so often that it's acquired the ring of truth. And, in fact, it seems superficially consistent with the data. Although the Vanguard 500 Index fund ranks 86th of 336 domestic large cap funds over the past 10 years, the DFA US Small Company and Vanguard Small Cap index funds rank only 34th and 38th, respectively, out of 85 domestic small cap funds. (The actual performance of these index funds is in fact a bit better than this because the Morningstar database I used suffers from survivorship bias. In other words, the worst-performing funds didn’t survive to make it into the sample. This is particularly true of the small cap funds, where it is likely that on 1/1/90 there may have been as many as 100 to 120 funds.)
Still, at first glance it appears that large cap indexing works better than small cap indexing. Enter Dunn’s Law. What the erstwhile Mr. Dunn observed is that indexing works much better with large than small cap stocks simply because during the past decade large caps have outperformed small caps. The key concept here is that of "asset class purity." An actively managed large-cap fund is likely to own some medium or even small cap stocks which will drag down its performance relative to the index, while an actively managed small cap fund will likely own some larger companies which will have the opposite effect. When you buy an index fund you are getting the unvarnished item, for better or for worse. So the recent impressive performance of large cap indexing, as well as the not-so-impressing showing of small cap indexing are simply an artifact of recent asset class performance; unless you believe that large cap dominance is a permanent state of affairs, indexing should work equally well in all categories.
I’ve already covered this ground in a previous piece. John Rekenthaler more recently looked at the data from a somewhat different perspective (and, to my chagrin, came up with bigger t-stats than mine). For example, take a gander at the summary graph from his piece:
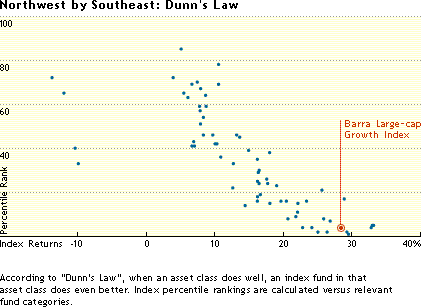
Mr. Rekenthaler’s graph is a bit confusing, since his y-axis is conventionally plotted, meaning that the best index performances are at the bottom (the best performers have the lowest numbers—1st percentile is the top percentile, 100th the worst). But it is quite clear that there is a strong relationship between how well the asset class does and how well indexing that class works. In fact, if you closely examine his plot you’ll see that the relationship is curvilinear; there isn’t much difference between indexing the best and the middling asset classes. Index performance only begins to suffer with the very worst asset classes.
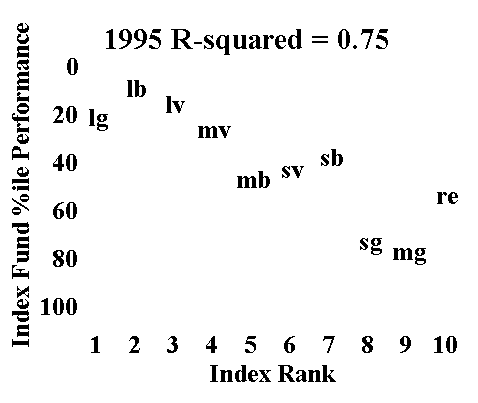
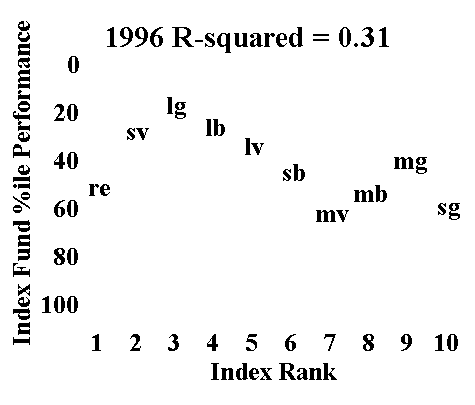
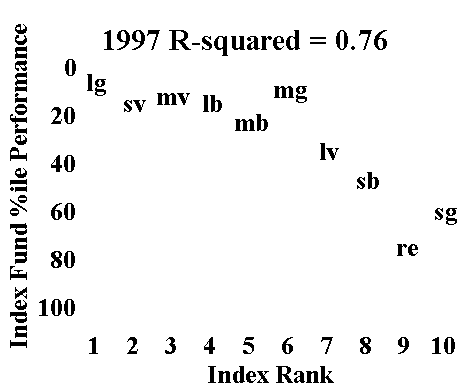
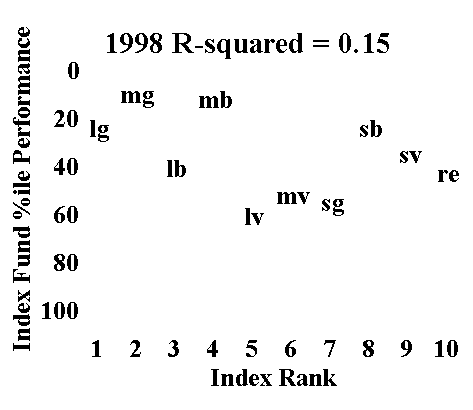
Dunn’s Law is important enough that it deserves regular review. In this issue I decided to look at the index performance of domestic funds over each of the past 5 years. For consistency’s sake I’ve used the S&P/Barra indexes for the 9 style boxes instead of the funds; only with REITs did I use an actual fund, DFA’s:
Asset Class
Abbreviation
Index Used
Available Fund
Large Cap Growth
lg
Barra LG
Vanguard Growth Index
Large Cap Blend
lb
S&P 500
Vanguard 500 Index
Large Cap Value
lv
Barra LV
Vanguard Value Index
Mid Cap Growth
mg
Barra MG
None
Mid Cap Blend
mb
S&P 400
Vanguard Mid Cap Index
Mid Cap Value
mv
Barra MV
None
Small Cap Growth
sg
Barra SG
Vanguard Small Cap Growth Index
Small Cap Blend
sb
S&P 600
None
Small Cap Value
sv
Barra SV
Vanguard Small Cap Value Index
REIT
re
DFA REIT
DFA REIT
I then ranked, from 1 (best) to 10 (worst), the performance of each index, and plotted it versus the percentile performance for the index in each style box versus the active funds. Purists will chafe at the use of an index instead of an actual fund, but since funds were not available for all of the indexes I wanted to be internally consistent. Further, of the 6 funds available from Vanguard 4 have managed to equal or surpass their benchmarks by small amounts. Lastly, as already noted, survivorship bias tends to understate index/fund percentile performance. Here are the results for the 5-year period from 1995 to 1999:
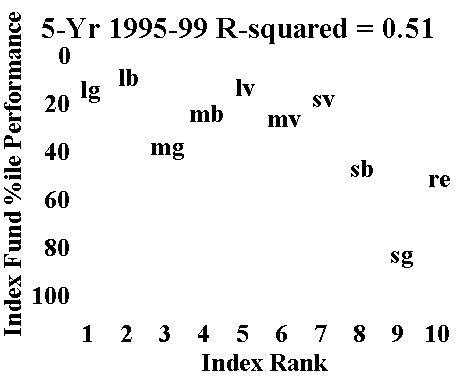
As you can see, there’s an excellent relationship between asset class relative performance and index fund performance; the R-squared value indicates that 51% of index fund performance is explained in this manner.
But the annual data is even more fascinating:
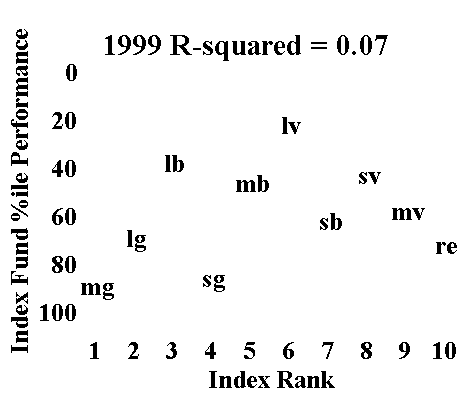
Note that in 1995 and 1997 the relationship was nearly perfect, in 1996 and 1998 fairly good, but that things fell apart in 1999. What happened? 1999 was a terrible year for indexing in general, for simple reason that a lot of tech/internet stocks with scorching performance and sizeable market caps didn’t make it past the S&P committee fast enough. Take a close look at the 1999 plot. What is clearly seen is that indexing value stocks worked tolerably well, growth stocks terribly, and blend/market in between. And within each of these categories (growth, blend/market, and value) Dunn’s Law actually worked pretty well.
Again, see Mr. Rekenthaler’s superb exposition of this phenomenon. In order to test his hypothesis that the failure of Dunn's Law in 1999 was due to nonbenchmark NASDAQ stocks (the NASDAQ has no tech-stock inclusion lag) I plotted the correlation of the asset class rank and index fund percentile ranking (which can be thought of as an indicator of how well Dunn’s Law works) versus the difference in performance between the NASDAQ index and the Wilshire 5000:
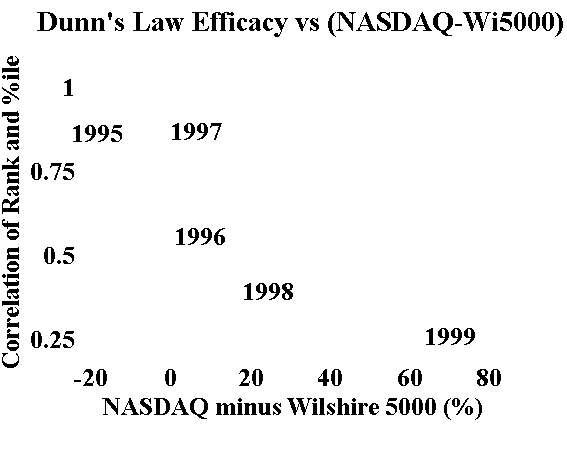
As you can see, as long as the NASDAQ does not outrageously outperform the market, Dunn’s Law works very well.
All of the above plots, save 1999’s, demonstrate the same overall curvilinear relationship shown by Mr. Rekenthaler’s data—there isn’t that much difference in indexing efficacy between the best and the middling asset classes in for a given time period, and only the worst classes show poor indexing performance.
And finally, the "big picture" is that for the full 5-year period the average performance over all 10 asset classes for indexing was 32nd percentile, even before factoring in survivorship bias.
Dunn’s Law is a powerful way of understanding the relative efficacy of indexing different asset classes. In future pieces we’ll apply it abroad.


Copyright © 2000, William J. Bernstein. All rights reserved.