Efficient Frontier

William J. Bernstein
![]()
The Gospel According to Ibbotson, Part IIIn the short run, the market is a voting machine. In the long run, it's a weighing machine.—Ben Graham
Efficient Frontier
William J. Bernstein
![]()
The Gospel According to Ibbotson, Part IIIn the short run, the market is a voting machine. In the long run, it's a weighing machine.—Ben Graham
(Author's Note: This article is an edited and updated version of a previous piece.)
Roger Ibbotson and Rex Sinquefield are two of the great pioneers of modern finance. They spent years toiling in obscurity so that investors could obtain an accurate picture of the long-term returns and risks of various classes of stocks and bonds. They have since achieved well-deserved fame and fortune for their many accomplishments. Anyone citing financial data beginning in 1926 without mentioning their names commits petty plagiarism. But just how likely is it that the next twenty or thirty years are going to look anything like the last seventy?
For those who have just arrived from another galaxy (or spent too much time watching X-files), the "Gospel According to Ibbotson" is as follows:
1) When one invests in a very safe asset, such as T-bills, she obtains a paltry long-term return, barely greater than inflation. For 1926 through 1998 this was about 3.75 percent.
2) Investment in longer-term high-grade bonds is riskier because interest-rate fluctuations can affect principal value. For bearing this risk, one was rewarded with a premium of about 2 percent over the risk-free Treasury bill or about 5.75 percent (3.75 percent + 2 percent) for 1926-98.
3) The common stock of large US corporations is even riskier, and for bearing this risk, one was rewarded with an "equity risk premium" of 7 percent over T-bills or 10.75 percent (7 percent + 3.75 percent) for 1926-98.
4) Finally, there was a 2 percent "small-stock premium" earned for exposure to this dicey area, with a long-term return of 12.75 percent for 1926-98.
This catechism has become the conventional financial wisdom of our time. Read the business section of the Peoria Tattler for more than a few days and you quickly become aware that for the long haul, stocks beat bonds by a wide margin.
The Dividend Discount Model
Probably the most time honored method of estimating future stock returns involves the so-called "dividend discount" method. It goes something like this: Over a long enough time period, all companies go bankrupt. (Take a look at the stock page from the Civil War and you will find that almost none of the names are recognizable.) The value of a stock thus comprises the inflation-adjusted total of all of its future dividends. If you were a Rip Van Winkle investor who invested $10,000 in the stock market and then went to sleep for 200 years, all you would be left with when you woke up would be generations of reinvested dividends from a long list of mostly defunct companies. (Mind you, this would be a very large amount of money.) Estimating the value of a stock or stock market by this method is a very complicated calculation, but can be simplified as follows:
Long-term stock return = dividend yield + growth rate
The return of a long bond is even simpler to calculate: it will be very close to its coupon.
In 1929 stocks actually yielded about 4 percent, which almost exactly predicted the 9.5 percent long-term return from that date. There were, of course, a few bumps on the road to that return. In 1929 the coupon on long-term AAA corporate bonds was 4.8 percent—also almost exactly on the mark.
As we start 1999, things look a little different. The current dividend yield of the S&P 500 is about 2 percent, and the most generous estimates of economic growth are about 5 percent. This gives an expected return on common stock of only about 7 percent, which is not much greater than the 5.5 percent coupon on corporate bonds. Thus, over the next few decades, stock returns should be only slightly higher than bond returns. Simply put, the current optimism surrounding stock investing does not appear to be well founded. (In fact, earlier this year the expected returns of corporate bonds calculated in this manner briefly exceeded that of stocks.)
Market history also provides some clues concerning future return. Consider the famous 1929 Lady’s Home Journal interview with financier John Raskob:
Suppose a man marries at the age of twenty-three and begins a regular savings of fifteen dollars a month—and almost anyone who is employed can do that if he tries. If he invests in good common stocks and allows the dividends and rights to accumulate, he will at the end of twenty years have at least eighty thousand dollars and an income from investments of around four hundred dollars a month. He will be rich. And because anyone can do that I am firm in my belief that anyone not only can be rich but ought to be rich.
Sound familiar? At the end of the day, the primary rule of investing is this: one is compensated mainly for shouldering perceived risk. The operative word here is perceived. In 1929 stocks were perceived as not all that risky; hence 10- to 20-year returns were not all that high. Of course in 1929, the actual risk was much higher than the perceived risk. In 1933 the reverse was true—the only prudent investment at that point was high-quality bonds, and only a fool invested in stocks. The perceived risk of equity was very high. And, as we all now know, 1933 was the best time this century to buy common stocks.
What of debt? The bond debacle of the late 1970s and early 1980s was unlike anything previously experienced in the fixed-income markets since the revolutionary war. Even today's youngest investors were likely scarred by the bond market carnage of 1994. The perceived risk of bonds is historically quite high, and consequently so is their expected return. A buyer of long-term corporate debt can reasonably anticipate a 4 percent real rate of return, and if you wish the full faith and credit of the US government you are guaranteed a 3.6 percent real return with the new inflation-adjusted bonds. Both of these returns are significantly higher than the historical 2 percent real bond return. (In 1982 investors would have given their right arms for 3.5 percent above inflation, government guaranteed.)
Is it possible to measure perceived risk in an objective manner? Yes. The popular investment memory extends back 5 to 10 years. By measuring the trailing 10-year standard deviation of returns we obtain a good proxy for the investing public's perception of the given asset’s risk. I've plotted the trailing 10-year SDs for common stocks and 20-year Treasury bonds for 1926 through 1998:
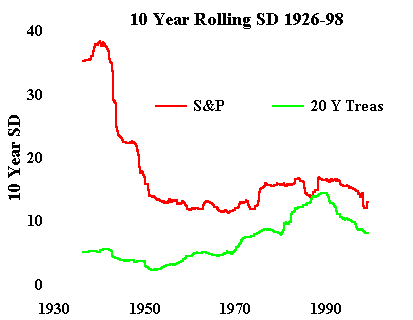
What does this graph tell us? Sixty years ago the perceived risks of stocks were extraordinarily high and the perceived risks of bonds quite low. Over the past 60 years the two have almost converged. Until this year's stock market turmoil, in fact, stocks were perceived as being only marginally more risky than bonds. If the perceived risks of stocks and bonds are similar, is it reasonable to continue to expect a 5 percent equity premium?
The REIT Stuff
Real Estate Investment Trusts (REITs) are a relatively recent creation. These companies manage pools of properties and mortgages, and by law pass through 95 percent of their earnings as dividends. Consequently, their dividend yield is quite high—always in excess of 4 percent—and when they fall out of favor, as high as 8 percent. Over the long haul, REIT returns seem to be about on a par with industrial stocks.
Currently REITs yield 7 percent, and historically this yield seems to have about a 5 percent growth rate. In other words, they have the same expected growth rate as industrial companies, but a 5 percent higher yield. Using the dividend discount model, their expected return should thus be 5 percent higher—about 12 percent. What's going on here? Why should an asset class with roughly the same risk as the S&P 500 have a much higher expected return? To add to the mystery, the correlation of REIT returns with other asset classes is in general much lower than that of the S&P 500. For example, the correlation of monthly returns for the past 23 years for the S&P/EAFE pair is .47, while for REIT/EAFE it is .37. According to classical theory, an asset with a lower correlation with the overall market should have a lower, not a higher, return.
I suspect that we are staring at a huge market anomaly. For future returns of the S&P 500 and REITs to be equal, REIT earnings/dividends must grow 500 basis points more slowly than industrial stocks annually from now to eternity. Possible, but not likely. Why this apparent discrepancy? There is a fair amount of evidence that companies do not make terribly efficient use of retained earnings. (Can you spell Snapple?) In other words, shareholders do a better job of investing a company's earnings than the company itself. It's quite possible that we would all be better off if Congress mandated a 95% payout ratio for industrial stocks as well as REITs.
The Coward's Approach
To summarize, a rudimentary but time-tested model predicts an expected return for the S&P 500 of 7 percent, for long-term corporate bonds 5.5 percent, and for REITs 12 percent. Does this mean we should all own portfolios consisting of 100 percent REITs? Hardly. First of all, such a portfolio would fairly ooze nonsystematic risk. Second, our predictions could be wildly inaccurate. If you don't own REITs, however, now might be a good time to allot a few percent of your portfolio to them. If you already do, a few percent more might be in order.
For simplicity's sake I've not addressed the expected returns of other important asset classes—chiefly small stocks and foreign stocks. However, they are probably slightly larger than the S&P 500 by a percent or two. For example, the dividend yield of the Russell 2000 small-stock index is about the same as the S&P 500, but the earnings/dividend growth of this index will probably be slightly higher. Emerging markets stocks currently have much higher dividend yields and long-term expected growth rates as well, but also have risks to match.
At the end of the day, stock returns do not issue from historical data, regression analysis, or multi-factor models, but are the direct result of owning a slice of the economy. The equity valuations of 1999 do not even faintly resemble those of 1926, and it is dangerous to extrapolate the next few decades of equity returns from the post-1926 data.
We owe a debt of gratitude to Ibbotson and Sinquefield for providing us with an accurate estimate of past stock returns. In the process they have accomplished something even more valuable: their historical data validates the dividend discount model to within a few dozen basis points. This model is likely to provide us with a more accurate estimate of future returns than simply expecting a reprise of past results.
To paraphrase Mr. Graham, in the long run the market is a weighing machine, not a Xerox machine. The scales still work. The parcels will be lighter.
![]()
![]()
![]()
![]()
copyright (c) 1999, William J. Bernstein