Efficient Frontier

William J. Bernstein
Efficient Frontier
William J. Bernstein
![]()
The Final Cowards' Update
The Cowards continue to gain ground lost in the madness of 1995-1999. In 2000-2001, the asset-class scene had reversed course, with many "unconventional" assets outperforming the S&P 500. This happy trend continued in 2002. Below are the 3- and 5- year returns for some major asset classes. As you can see, the S&P has not been the place to be:
Index
Index Fund Sampled
3 Yr. Return
5 Yr. Return
Continental Small Companies
DFA Continental Small Co.
-1.30
2.27
Emerging Markets (Equally Weighted)
DFA Emerging Markets
-15.75
-1.44
Small Japanese Stocks
DFA Japanese Small Company
-8.95
0.11
EAFE Index
DFA Large Cap International
-16.53
-2.45
Pacific Rim Small Companies
DFA Pacific Rim Small Company
-4.45
3.75
U.S. Small-Medium Companies
DFA U.S. Small Cap
-2.26
2.04
U.S. Small Companies
DFA U.S. Micro Cap
0.87
4.31
U.K. Small Companies
DFA United Kingdom Small Co.
-7.58
-0.12
REITs
DFA Real Estate Securities
14.82
4.65
S&P 500
Vanguard 500 Index
-14.60
-0.61
Emerging Markets (Cap Weighted)
Vanguard Emerging Markets Index
-13.32
-4.99
EAFE-Europe
Vanguard European Stock Index
-5.15
-2.93
Precious Metals Stocks
Vanguard Precious Metals
13.50
12.60
U.S. Growth Stocks
Vanguard Growth Index
-19.74
-1.09
EAFE-Pacific
Vanguard Pacific Stock Index
-20.84
-4.41
U.S. Value Stocks
Vanguard Value Index
-9.57
-0.93
(For those of you unfamiliar with the cowards, the July 1997 update has a detailed description of these portfolios and the methodology used.)
Once again, a globally diversified, passive approach continues to best most active global management. Nevertheless, I’m killing the Cowards for three reasons:
The point has been proven.
The three passive Cowards were chosen purely for illustrative purposes; none of them represents an optimal approach on its own. The original Coward’s Index is an institutionally oriented benchmark with no value exposure; the Small Investor’s Coward is the retail version of the same, and the Academic Coward is an all-value version. All three are extreme cases. A more reasonable strategy blends the all-value approach of the Academic Coward with the all-market exposure of the other two and includes some REIT exposure, at least for those with sheltered accounts.
Maintaining the Cowards takes a lot of time, which I’m growing increasingly short of. Since there’s a dandy off-the-shelf global small- and value-weighted benchmark out there—the DFA "Balanced" portfolio, I’m going to defer to it. (It’s also a benchmark we use in our advisory business.)
There are actually two DFA balanced strategies, one for stocks and one for bonds, which we then blend depending on equity exposure. Here they are:
20% U.S. Large-Cap GrowthStocks
20% U.S. Large-Cap Value
10% U.S. Small-Cap Growth
10% U.S. Small-Cap Value
10% REIT
10% International Large-Cap Value
5% International Small-Cap Growth
5% International Small-Cap Value
3% Emerging Markets Large-Cap Growth
3% Emerging Markets Large-Cap Value
4% Emerging Markets Small-Cap Growth
Bonds
25% One-Year Corporate Bonds
25% Two-Year Global Bonds
25% Five-Year U.S. Government Bonds
25% Five-Year Global Bonds
For those without access to DFA, Vanguard maintains analogous domestic funds, and its International Value fund tracks DFA’s fairly closely. As to the other 20% (small international and emerging markets stocks), you’re on your own—I’d suggest splitting them between the Vanguard European, Pacific, and Emerging Markets funds. (And, if you’re going the Vanguard route, you might consider a "five-corners" domestic approach by equally weighting the four diversified domestic styles and REITs, because the small and value weighting of the Vanguard funds is lower than DFA’s.)
That said, here are the 3-, 5-, and 10-year plots for all five Cowards.
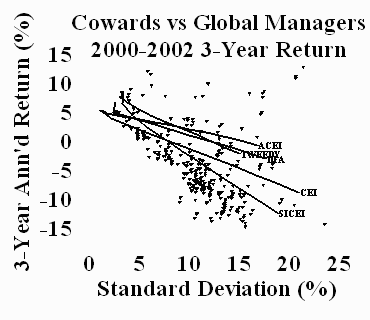
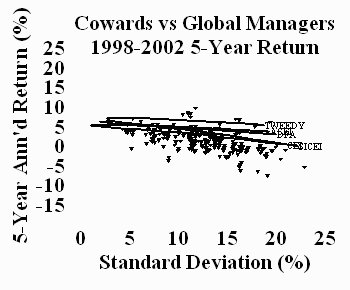
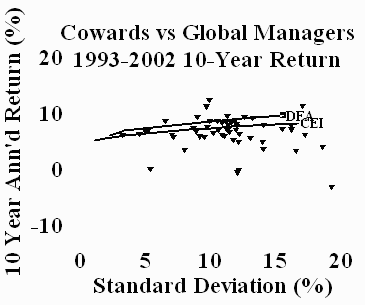
First, note that over the past three and five years, holding stocks was no great blessing, either with the Cowards or the active managers—even over ten years, equity was not that helpful. Second, I’ve used the "expanded" scale for this and last year’s report to include the worst-performing funds, which illustrates an important point. Although over most time periods, it is not difficult to find a fund that did somewhat better than the Cowards, they do not do so by a great margin. However, if you are unlucky, you could get hit with a real clunker. Realize also that at five and ten years, there is considerable survivorship bias; the very worst funds have already been pruned away. Last of all, note how important value exposure has been—the Academic Cowards have shined over the past three years, and done pretty well over the past five.
The Tweedy Coward is slipping, as you can see by comparison to last year. This year has not been kind to the foreign currencies, and they have suffered accordingly. Tweedy no longer leads the Academics at three years. Also, truth be told, the Tweedy Browne Global Value Fund was a "lucky pick"—Tweedy also runs the domestically oriented Tweedy Browne American Value Fund, and it hasn’t done nearly as well. A reasonable test of the Tweedy approach versus the Academics, which is only half foreign, is to construct a benchmark of 50% each of the two Tweedy funds. I’ve done so below, and the plot tells the tale.
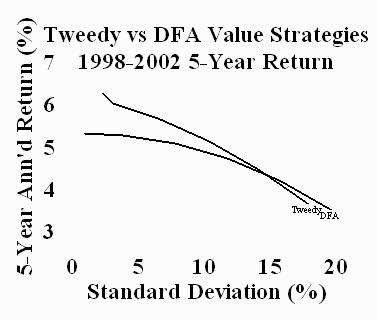
I'll still tip my hat to Tweedy Browne. If you're going to actively manage a portfolio, this is how to do it; too bad their fees are so high. As to almost everyone else, the data are overwhelming. At long last, I’m relieving myself of the quarterly Coward updating process, declaring victory, and going home. From time to time I may provide updates of active global allocators versus the DFA approach, but for now, the Cowards and I are taking a much-needed rest.
![]()
![]()
![]()
![]()
Copyright © 2003, William J. Bernstein. All rights reserved.
The right to download, store and/or output any material
on this Web site is granted for viewing use only. Material may not
be reproduced in any form without the express written permission of William
J. Bernstein. Reproduction or editing by any means, mechanical or electronic,
in whole or in part, without the express written permission of William J.
Bernstein is strictly prohibited. Please read the disclaimer.