Efficient Frontier

William J. Bernstein
Efficient Frontier
William J. Bernstein
![]()
Dow 36,000!
The market can be thought of as a giant tug-of-war between two teams, one of which thinks that the market is too high, the other too low. Straining at the very far right end of the rope are two fellows named James Glassman and Kevin Hassett (GH). Writing in the op-ed section of the Wall Street Journal, the Atlantic Monthly, and finally in their best-selling above-titled book, they contend that the market, far from being historically overvalued, is actually ridiculously undervalued. Nervous at Dow 11,000? Get over it. This fearless duo sees fair value at about 36,000.
The problem, as we shall see, is that they arrive at this number by using a model which is exquisitely sensitive to its inputs. Then they diddle those inputs to arrive at their highly agreeable conclusions.
Their chosen vehicle is the venerable dividend discount model (DDM). Formulated in 1938 by John Burr Williams, it rests on a deceptively simple premise: Since all companies eventually go bankrupt, the value of a stock, bond, or of an entire market is simply the value of all its future dividends discounted to the present. (In GHspeak, this is referred to as the "perfectly reasonable price," or PRP.) Since a dollar of future dividends is worth less than a dollar today, its value must be reduced, or discounted, to reflect the fact that you will not receive it immediately. This amount of reduction is called the "discount rate" (DR). And as we shall soon see, fiddling even a little bit with the DR opens the door to all kinds of mischief.
If this model looks complicated, it is. For each future year you take the present dividend, multiply it by (1+r)n, where r is the rate of dividend increase and n is the number of years in the future, and then divide by (1+DR)n. Plus, you have to compute this for an infinite number of years. And it can get worse, with two- and three-stage models with varying growth rates over time.
Fortunately, with a constant growth rate the whole infinite sequence simplifies to:
PRP = (div)/(DR-g) where PRP = "perfectly reasonable price," div = annual dividend amount, DR = discount rate, and g = dividend growth rate
If the Dow throws off about $150 per year in dividends, and the dividends are growing at 6% per year, then the only other number left to toss into the above equation is that pesky DR. And amazingly, throughout most of the article GH maintain that the appropriate DR is the treasury bond rate, which at the time they wrote the piece was 5.5%. Because the DR is less than the growth rate, an infinite value for the market results (you don't want to know), which even they find hard to swallow. (What the authors missed is that 6% rate covers a period when inflation was around 4%-5%, while the recent 5.5% rate for T bonds presumably reflects a considerably lower future inflation rate.) So lower the dividend growth to 5.1%, keep the DR at 5.5%, and abracadabra, the above equation yields Dow 37,500.
To demonstrate just how squirrely this model is, I've plugged the above numbers into the simplified DDM equation:
PRP = 150/(0.055 - 0.051) = 150/0.004 = 37,500
Per finance convention, the numbers on the bottom are expressed as decimals, where .055 refers to the DR of 5.5%, and 0.051 to the dividend growth rate of 5.1%. Notice how tiny the denominator of 0.004 is relative to the input numbers. Move both of the numbers in the denominator the wrong way by just 1% (.01) and you have a Dow PRP of 6250. And if that displeases you make your estimates just a hair more optimistic, and you get a Dow PRP of infinity.
The odor of a small furry rodent begins to waft. For starters, note the proximity of the growth rate and DR, and how that proximity makes the denominator in the discount-rate calculation a teeny-tiny 0.4%. This is akin to balancing an elephant on fence post: One small wobble in the post, and several thousand pounds will lurch in an unexpected direction. This is evidenced by the following graph, which shows the DJIA’s value using the Glassman/Hassett growth assumptions over a range of discount rates.
For clarity I've plotted this relationship between DR and Dow PRP:
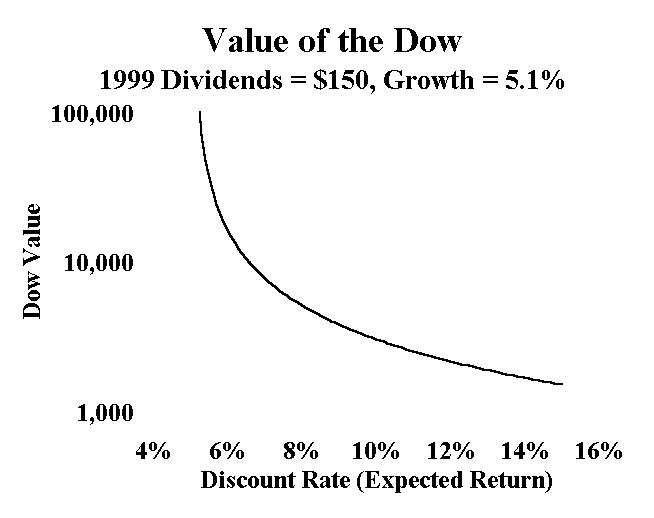
Once again, the value of the DR is critical. For example, if the actual DR is 8% instead of 5.5%, then fair value for the Dow falls to 5,172. Oops. The same thing happens if the dividend growth estimate is off. As already mentioned, the dividend 6.1% growth of the past decades included over 4% of inflation. In other words, real growth was less than 2%. So the dividend growth rate going forward may be quite a bit lower than it has been in the past. Decreasing dividend growth by 2.5% has the same effect as increasing the DR by the same amount—Dow 5,172.
So what determines the appropriate DR? It is very simply the cost of money (or the risk free rate), plus an additional amount to compensate for risk.
Think of the DR as the interest rate a reasonable lender would charge a given loan applicant. The world’s safest borrower is the US Treasury. If Uncle Sam comes my way and wants a long-term loan I’ll charge him just 6%. At that DR the DDM predicts that a perpetual $1.00 annual loan repayment, or coupon, is worth a $16.67 loan.
Next through the door is General Motors. Still pretty safe, but not as riskless as Uncle Sam. I’ll charge them 7.5%. At that DR a perpetual $1.00 repayment/coupon is worth a $13.33 loan.
Finally, in struts Trump Casinos. Phew! For the risk of lending these clowns my money I’ll have to charge 12.5%, which means that The Donald’s perpetual $1.00 repayment/coupon is worth only an $8 loan.
So the DR we apply to the market’s dividend stream hinges on just how risky we think the market is. And here things get really sticky. Relying on long-term data, GH observe that the stock market is actually less risky than the long treasury bond. For example, since 1926 the worst 30-year annualized return for common stocks was 8.47%, versus 1.53% for treasuries.
Of course, a very different picture emerges when one looks at shorter periods. For example, the worst 1-year returns are –43.35% for stocks, and –7.78% for bonds. And at a gut level, no matter how much of a long-term investor you think you are, the market still probably got your attention on October 19, 1987.
So the GH-Dow controversy depends on whether you think that investors experience risk as a short-term or a long-term phenomenon. What the authors are saying is that US investors have abruptly lengthened their risk time-horizon:
Seventy years ago few investors understood that excessive trading undermines profits, that stock-price fluctuations tend to cancel themselves out over time, making stocks less risky than they might appear at first glance, and that it is extremely difficult to outperform the market averages. Americans have learned to buy and hold.
One wonders what planet GH inhabit. Are they unaware that trading volume has been steadily increasing for decades, not decreasing? That average domestic mutual fund turnover has increased from 30% to over 90% in the past 25 years? That a recent survey of over 66,000 accounts at a "large west coast discount brokerage" showed an average annual portfolio turnover of 75%? That only 7% of mutual fund investments are indexed? That the historically modest market declines of 1987, 1990, and 1997, far from resulting in inflows from legions of long-termers buying cheap, produced dramatic mutual fund outflows? Most authoritatively of all, in an elegant study published in the Quarterly Journal of Economics in 1993 Shlomo Benzarti and Richard Thaler calculated that the risk-horizon of the average investor was just one year.
The easiest way of thinking about the interplay of short- and long-term risk is to imagine a new kind of 30-year treasury bond, similar to the conventional bond, except that the government stands ready at all times to redeem it at par. Clearly, the redeemable bond would carry a considerably higher price/lower yield because of its lower short-term volatility. And yet on the GH planet, where investors only care about long-term return, it would be priced identically to the conventional 30-year bond, since both have the same return to maturity.
Even conceding GH’s point that investors are increasingly focused on stocks for the long run and will manage to push the Dow up past 36,000, one has to ask just how risk free stocks would be at that point. The authors ignore a rather inconvenient fact: that recent market history has dramatic effects on DR. In 1928, just as today, everybody was a "long-term investor," and the DR for stocks was quite low (although probably not as low as it is today). Five years later, with the attrition rate of buy-and-holders approaching 100%, the DR was dramatically higher. And at Dow 36,000, it wouldn’t take much of a change in the DR in order for the risk free world of stocks to come to an abrupt end. If investors decided that they demanded even a measly 1% risk premium, the Dow would decline by about two thirds. The irony being that to the extent GH are right about a near term "correction" of stock prices past 36,000, the risks of subsequent stock ownership increase dramatically.
Ignoring the crash scenario still does not make the GH planet look very appetizing. If the true discount rate is 5.5% and the Dow "correctly" priced at 36,000, then the future return of stocks is also 5.5%. Assuming inflation averages 2.5% over the next 30 years, that’s a real return of just 3.0%. Why would any rational investor invest in stocks with treasury inflation protected securities (TIPSs) priced to produce a guaranteed 4.35% real return?
There are other, more fundamental problems with Dow 36,000. For starters, consider the significance of a 5.5% long-term stock return. The "cost of capital" for corporations is necessarily the same as this long-term return. At a dirt-cheap capital cost of 5.5% do you think that corporations are going to be particularly careful with how they spend it? The free-spending behavior of the dot.coms, whose capital comes even cheaper, is not encouraging. (Or, on a grander scale, just how careful is Uncle Sam with his 5.5% capital?)
In essence, the authors have improved on Professor Irving Fisher's famous 1928 faux pas: "Stock prices will soon reach a permanently high plateau. Although the destination will be deadly dull, the ride there will be a real barn burner."


Copyright © 2000, William J. Bernstein. All rights reserved.