Efficient Frontier

William J. Bernstein
Efficient Frontier
William J. Bernstein
![]()
The Slippery Slope of Fund Expenses, Part II
In July's EF we looked at the relationship between fund expense and return and came to a remarkable conclusion; that for every dollar paid in fees, 2 dollars were lost. Further, it appeared that while fund turnover hurt value stock funds, it actually seemed to help growth mutual funds. I began to wonder if growth fund managers were not successfully purchasing momentum-related excess return with their turnover expense.
Both of these issues were important enough that I decided to look at the issue "out-of-sample" in order to make sure that I wasn't "data mining"—in other words, being fooled by random variations in the data. Fortunately, sitting in the Efficient Frontier Museum of Investment Technology (my wife's old PC in our basement) is the January 1994 version of Morningstar's "Onfloppy for Mutual Funds," which contains the 5-year returns data for 1989-93. Morningstar's data wasn't yet sorted by their handy-dandy style boxes, so I devised my own sorts. The breakpoints for value/blend and blend/growth were at a P/B ratio of 3 and 4, respectively. The breakpoints for small/medium and medium/big were placed at $1.8 billion and $5.5 billion. Regressing 5-year return versus fund expenses and turnover, here's what I found:
Fund Category
Return/Expense Slope
Return/Turnover Slope
Large Growth
-2.02
-0.25
Large Blend
-2.15
+0.15
Large Value
-2.23
-1.30
Medium Growth
-2.47
+1.27
Medium Blend
-3.15
-0.25
Medium Value
-1.50
-1.05
Small Growth
+0.06
-0.02
Small Blend
-2.81
+1.86
Small Value
-1.86
+1.27
For starters, the -2 slope between expense and return seems to hold up nicely. We just don't have an explanation. Further, for large and medium cap funds it seems that value funds are more badly hurt by turnover than growth funds, as was found in 1994-8. But the small cap category shows the opposite.
Let's discuss the turnover issue first. Although I continue to suspect that growth fund managers can mitigate the effects of turnover with the benefits of momentum investing, the data are not entirely convincing. One problem is that I'm using the "spot" turnover figure, taken at the end of the 5-year period. Since turnover can change dramatically for a given fund from year to year, a more accurate picture could be obtained using average turnover for the whole period, but I don't have this data. Mark Carhart, in his landmark 1997 Journal of Finance article on mutual fund persistence, found an overall return/turnover slope of -.97 with a modestly impressive -2.36 t-stat. Combining my data for the two time periods, I think that it's clear that value funds are hurt by turnover, but not much can be said about growth funds. But the turnover data are weak, and there's no way that it can account for the 2-to-1 effect of fund expenses on return.
A stronger statement can be made about fund expenses; they are an extraordinarily corrosive drag on investment return, costing twice as much as you'd guess at first blush. I don't have a good explanation for the fact that fund expenses seem to subtracted not once, but twice, from returns. In fact, the closer that one examines this problem, the more mysterious it gets. In the July issue I postulated an explanation based on moral turpitude—fund families which saw nothing wrong with high expenses would also tolerate other activities which were not beneficial to the shareholders. So I looked at the 15 year (7/84-6/99) R/E slopes for load and no-load funds and was flabbergasted to find that the slope was only -1.25 for load funds (95% CI -1.45 to -1.05, R squared 0.46) versus -2.76 for no-loads (95% CI -3.76 to -1.76, R^2 0.195). Thus, with a huge degree of statistical confidence (completely separated 95% CI) load funds have less of an expense penalty than no-load funds. Don't ask me why.
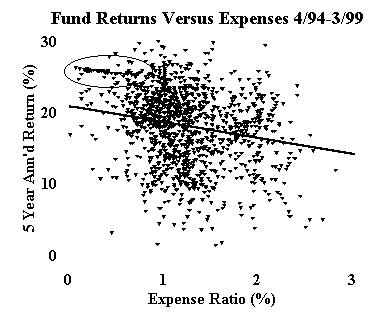
I've got a warning for anybody who wants to play this game—it's a fascinating and somewhat addicting labyrinth. For example, take a look at the 5-year R/E plot from the July article:
Notice the rather straight line of data points in the upper left corner of the graph (circled). What are these? If you guessed S&P 500 index funds, then go to the head of the class. The slope for these index funds, by the way, is only -1.28 (95% CI -1.41 to -1.15 with an amazing R^2 of .93). On the other hand, the R/E slope for foreign funds is in the -4 to -5 range. Again, surprisingly, there is no contribution from turnover.
So, to summarize:
- There is robust evidence that a dollar of fund expense costs much more than a dollar of fund return.
- This is not due to turnover or moral turpitude.
- Turnover may cause minor changes in return, most noticeable for value funds. There may or may not be a positive effect of turnover for growth funds.
I'd be delighted to hear from or share my data with anybody who can come up with a rational explanation for the above observations. To paraphrase Jack Bogle, costs matter much more than you'd expect. It's just not clear why.


Copyright © 2000, William J. Bernstein. All rights reserved.